|
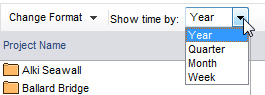
By default the Timeline Gantt opens with the time scale you last used when viewing the chart. Use the Show time by list to change the Timeline Gantt display time scale based on the length of the workspaces you are viewing.
By default the horizontal axis positions the current time frame in the first column. The current time frame is highlighted to make it easy to see.
Related Topics: