Viewing the Timeline Gantt Chart


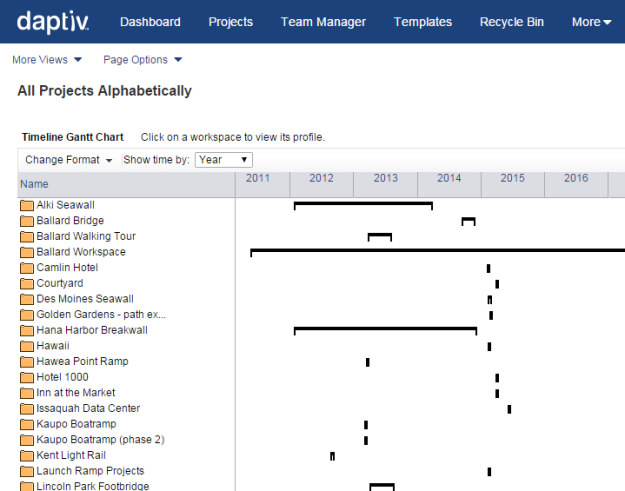
The Timeline Gantt chart provides a graphical overview of workspaces over the next year.

Each workspace is represented by a bar in the Timeline Gantt chart. The length of the bar indicates the time period the workspace will be active, based on the scheduled start and end dates for tasks in the workspace or, if no tasks have been created, on the planned start and end date for the workspace. Note: If a workspace appears to be just one day long, tasks may have been added and then removed. See Troubleshooting the Portfolio Application.

Clicking a workspace bar opens the Profile window for the workspace. You can change the time scale used on the chart.

The Timeline Gantt chart may not be available in some workspaces and workspace types.

TO VIEW THE Timeline Gantt chart:

  1. Open the Portfolio application. The Scorecard view displays.
  1. Click Change Format on the view toolbar, and Timeline Gantt. The Timeline Gantt view displays. By default the horizontal axis positions the current time frame in the first column. The current time frame is highlighted to make it easy to see.
    Note:
    The workspaces that display in the chart are those included in your current view. For more information, see Customizing Application Views.
  2. Click on a workspace bar to open the Profile window and view details of the workspace.
    You can edit the profile or update the status in the Profile window. For more information, see Working with Workspaces from the Portfolio Application.


Related Topics: